SimAmazoniaINFRA - Deforestation and CO2 scenarios
Part of the project SimAmazoniaINFRA.
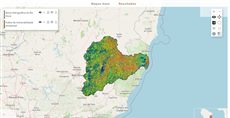
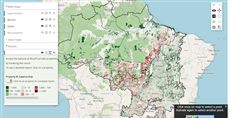
This map from SimAmazoniaINFRA (in Portuguese) shows simulated deforestation, CO2 emissions, biodiversity loss and transport infrastructure in the Amazon up to 2050. Click an Amazon region on the map, or pick it in the list, choose the Meta (target) or Tendencial (trend) scenario, and a floating window charts the region’s annual deforestation and CO2 emissions from 2019 to 2050 against a baseline, with the emission-reduction credits given by a small calculator (price per tonne of CO2, buffer pool, uncertainty, leakage). Other groups hold deforestation, biodiversity-loss, road and export-route results. The code is query 575.
How it is built
- A GeoJSON file layer you click. The regions are a
source: "file"layer (type: "geojsonurl") with its own default, hover and selected styles; itsonClickstores the region and redraws the charts. See JSON file source layer and clicking and hovering on features. - Data files. Two
loadcsvwidgets read the per-region series of each scenario; the biodiversity and ports layers load their own CSV files. See LoadCsv. - Charts in a window. Highcharts mixes columns (deforestation or emissions, discounts, credits) with a baseline line, drawn inside a
windowwidget; a second window holds the introduction and data sources. See charts and Window. - Timeline and combobox together. The kernel density layers (2019-2050) and the road simulation (2025-2050, every 5 years) pair a
timelinewith acomboboxof years;beforeCalckeeps both in step and shows only the chosen year. See timeline panel and Combobox. - Legends in the panel. The 2050 deforestation maps and the road simulation use
legendHtml. See LegendHtml. - Groups and shared code. Five
viewTitlegroups pass common settings throughdefaultProperties;setQueryGlobalPropertiesholds helpers such as closing the other result layers when one is turned on. See the layer and group model.
Try this
- Click another region, switch between Meta and Tendencial, then change “Valor por ton/CO₂” (10 USD by default) and watch the accumulated credits.
- In “Resultados - Desmatamento”, open “Densidade de kernel (2019 a 2050)”, choose a scenario and press play.
Reference: the parameters used here
Generated from the platform source. Every entry, searchable, is in the API reference; the raw data is api.json. Open an entry for its description, parameters and example; # links to it.
QUERY · setup calls and the running query
QUERY1 entrysetQueryGlobalProperties
function(globalProperties) : Booleanhelper# Defines globals for the query: every key of globalProperties becomes a window property (a value, an object or a function) that layer definitions, markup widgets (handler=, onMark=...) and …
setQueryGlobalPropertiesWritten as ExtjsUtils.QUERY.setQueryGlobalProperties
Defines globals for the query: every key of globalProperties becomes a window property (a value, an object or a function) that layer definitions, markup widgets (handler=, onMark=...) and other query code can reference by name. The names are recorded and the globals are deleted when another query loads. A key that already exists on window and was not created by the query is refused with "Global variable can't be redefined" in the console (the platform's own globals are protected; redefining one of the query's own keys is fine). runNow is the only key the platform itself invokes: right after the globals are registered QUERY.runNow is called once (see that entry). Chain it with && before the layer array so the globals exist when the layers are evaluated; QUERY_DESCRIPTION in the examples stands for that array.
- globalProperties Object
- Object whose keys become globals; each value may be a value, an object or a function.
Returns Always true, so the call can be chained with && QUERY_DESCRIPTION.
ExtjsUtils.QUERY.setQueryGlobalProperties({
  globalCount: 0,
  onLayerButton: function(btn) { console.log("clicked", btn); },
  runNow: function() { ExtjsUtils.ZOOM.limitZoomLevel(17); }
}) && [
  { name: "CSR:estados", visibility: true, descriptionHtml: "{{button|id=b1|text=Go|handler=onLayerButton}}" }
]
File layers: data
FileLayer1 entryurl
String# URL of the data of a source: 'file' layer, used by the types csv (a CSV file), jsonurl (a JSON array of plain objects) and geojsonurl (a GeoJSON file).
urlURL of the data of a source: 'file' layer, used by the types csv (a CSV file), jsonurl (a JSON array of plain objects) and geojsonurl (a GeoJSON file). Relative URLs are resolved against the Mappia page. Also available inside loadData as config.url for type: 'load'.
{
   name: 'example_points',
   source: 'file',
   type: 'jsonurl',
   // shipped with the platform: [{"lon":-50, "lat":-10, "name":"name1"}, ...]
   url: '/theme/app/data/points_example.json',
   coordinates: {x: 'lon', y: 'lat'},
}
File layers: style, events, drawing
VectorLayer5 entrieshoverStyle
Object# Defines the style that will be applied to the geometry when mouse is hovering.
hoverStyleDefines the style that will be applied to the geometry when mouse is hovering. PS: Accepts 'context' and 'rules'.
Property 'context': allows definition of functions.
Property 'rules': allows definition of filters (only the geometries that fit into this rule will be displayed). PS2: Hover depends on 'onHover' property that allows to hovering.
Look at some examples at: http://dev.openlayers.org/examples/
[{color: '${getColor}', context: {getColor: function(attr){return 'green';} }]onClick
function# Defines the callback function to the click event on Layer.
onClickDefines the callback function to the click event on Layer.
- event Object
- The click event Object.
- source VectorFileSource
- Auxiliary functions to deal with Vector Layer.
- inputs Array.<Object>
- Array with all layer input values.
{
     ...,
     onClick: function (feature) {
    console.log(feature.attributes);
         console.log("Triggered click event!");
     },
     ...
}
[{
name:"CSR:FileGeojson",
source: "file",
type: "geojsonurl",
url: "/theme/app/data/fip_interativo/amazonia/amazonia_municipios.geojson",
onClick: function(feature, layerSource, inputs, toggleStatus) {
console.log(arguments);
}
}]onHover
function# Defines the callback function on 'Vector Layer' hover.
onHoverDefines the callback function on 'Vector Layer' hover.
- evt Object
- Features.
- state Boolean
- True when hover starts, false when it ends.
- controller Object
- The controller itself.
- inputs Object
- Layer widget values.
{
     ...,
     onHover: function (evt, state, controller, inputs) {
         console.log(state ? "Started": "Ended");
     },
     ...
}
[{
name:"CSR:FileGeojson",
source: "file",
type: "geojsonurl",
url: "/theme/app/data/fip_interativo/amazonia/amazonia_municipios.geojson",
onHover: function(feature, state, controller, inputs) {
console.log(feature.attributes);
console.log(arguments);
}
}]selectController
OpenLayers.Control.CustomSelectFeature= undefined# The selection control created for the layer when onClick, onSelectionToggle or onHover is defined (undefined otherwise).
selectControllerThe selection control created for the layer when onClick, onSelectionToggle or onHover is defined (undefined otherwise). It is the OpenLayers.Control.CustomSelectFeature instance, so you can call its select(feature), unselect(feature), unselectAll(), activate()/deactivate() from layer callbacks, e.g. to select a feature found with findFeatureById.
functions: {
   selectFirst: function() {
      if (this.selectController && this.features.length) {
         this.selectController.unselectAll();
         this.selectController.select(this.features[0]);
      }
   }
}
selectStyle
Object# Defines the default style that will be applied to the selected geometry.
selectStyleDefines the default style that will be applied to the selected geometry. PS: Accepts 'context' and 'rules'.
Property 'context': allows definition of functions.
Property 'rules': allows definition of filters (only the geometries that fit into this rule will be displayed). PS2: Selected depends on 'onClick' property that allows to select.
Look at some examples at: http://dev.openlayers.org/examples/
[{color: '${getColor}', context: {getColor: function(attr){return 'green';} }]loadcsv · load a CSV table (input)
LoadCsv2 entriesWritten in a layer's descriptionHtml as {{loadcsv|parameter=value|...}}
getColunsInd
function() : Array.<String># Returns a copy of the header row — the column names, in order — so query code can discover columns instead of hard-coding indexes.
getColunsIndReturns a copy of the header row — the column names, in order — so query code can discover columns instead of hard-coding indexes. The name is a historical typo of getColumnsInd, kept for compatibility (the platform and many queries call it by this spelling; there is no correctly spelled alias).
Returns Copy of the header row.
var headers = inputs.id["fire_csv"].getColunsInd(); // ["Municipality", "Year", "Fires"]
var iFires = headers.indexOf("Fires");
getLines
function(columns, values, includeHeader) : Array.<Array.<String>># Returns the lines (arrays of cell strings) whose cells in columns equal the corresponding entries of values.
getLinesReturns the lines (arrays of cell strings) whose cells in columns equal the corresponding entries of values. Columns may be given by index or by header name; to filter on several columns give one value per column, e.g. getLines([1, "Year"], ["Park A", 2024]). Values are compared as strings (the CSV is always text). Called with no arguments it returns every data line (header skipped) — a common idiom. When all filtered columns were indexed with createIndexes the lookup uses the index instead of scanning every line.
- columns Array.<(String|Number)>
- Indexes and/or names of the columns to filter on.
- values Array
- One value per entry of
columns. - includeHeader Boolean
- True to also return the header line when it matches (only in the scanning path, i.e. without indexes).
Returns The matching lines; all data lines when no filter is given.
var csv = inputs.id["fire_csv"];
var rows2024 = csv.getLines(["Year"], [2024]);      // by header name
var rowsParkA = csv.getLines([0, "Year"], ["Park A", 2024]); // two columns
var allRows = csv.getLines();                         // every data line
Highcharts · charts
Highcharts1 entryUsage: (Highcharts.chart(DOM_ID, {});)
chart
function(renderTo, options) : Object# Highcharts is loaded by the calculator and editor pages, so a query can call Highcharts.chart(...) without loading anything: put a container in the layer's descriptionHtml and create the chart …
chartWritten as Highcharts.chart
Highcharts is loaded by the calculator and editor pages, so a query can call Highcharts.chart(...) without loading anything: put a container in the layer's descriptionHtml and create the chart once the panel exists - in onInputsReady, in beforeCalc or in a widget handler - then update it as results arrive instead of recreating it. ExtjsUtils.HIGHCHART.getById(id) gives the chart back from the container's id, which is what makes the update possible from another callback.
The bundled build covers the standard chart types plus highcharts-more. Extra modules are loaded on demand with AsyncLoader.loadScriptOnce (see the Sankey entry).
- renderTo String
- Id of the container element declared in
descriptionHtml. - options Object
- The Highcharts configuration object.
Returns The chart instance.
descriptionHtml: '<div id="emissions_chart" style="height:220px"></div>',
functions: {
    drawChart: function (values) {
        var chart = ExtjsUtils.HIGHCHART.getById('emissions_chart');
        if (chart) { chart.series[0].setData(values); return; }
        Highcharts.chart('emissions_chart', {
            chart: { type: 'column' },
            title: { text: 'Emissions by year' },
            xAxis: { categories: ['2020', '2021', '2022'] },
            series: [{ name: 'Mt', data: values }]
        });
    }
}
window · floating window (input)
Window2 entriesWritten in a layer's descriptionHtml as {{window|parameter=value|...}}
It can only be shown when the layer is visible.
btnID
String# Defines the id of the button that controls the window visibility.
btnIDDefines the id of the button that controls the window visibility.
|btnID = window-button-id|startVisible
Boolean# Defines if the window should start visible or not.
startVisibleDefines if the window should start visible or not. Set true if it should, false otherwise.
|startVisible = false|timeline · scenarios over time (input)
Timeline3 entriesWritten in a layer's descriptionHtml as {{timeline|parameter=value|...}}
nextStepInterval
Number= 2100# Defines the duration of the interval between steps of the timeline in milliseconds.
nextStepIntervalDefines the duration of the interval between steps of the timeline in milliseconds.
|nextStepInterval=1000|steps
Array.<Array.<(String|Object)>># Defines the timeline change steps.
stepsDefines the timeline change steps.
|steps=[["step_0"], ["step_1"], ["step_2"]]||steps=[['Nome', {style:"step_0_style",name:"CSR:estados"}], ['Região', {style:"step_1_style",name:"CSR:estados"}], ['Geocódigo', {style:"step_2_style",name:"CSR:estados"}]]||steps=[['Nome', 'step_0'], ['Região', 'step_1'], ['Geocódigo', 'step_2']]||steps=[{1990: "layer_style0", 1991: "layer_style1", 1992: "layer_style2"}, 1993: "layer_style3"}]|updateMainThumbValue
function(value)# Moves the main thumb to a step index (0-based position in steps), applying that step's style to the layer and firing change — the programmatic way to select a step.
updateMainThumbValueMoves the main thumb to a step index (0-based position in steps), applying that step's style to the layer and firing change — the programmatic way to select a step. Without an argument it re-syncs the thumb with the layer's current style using getValueFromStyle (used when another tool changes the style). The min/max thumbs are pushed outwards when the index falls outside the current range.
- value Number
- Step index; omit to sync the thumb with the layer's current style.
Ext.getCmp('years_tl').getTimeline().updateMainThumbValue(2); // third stepcombobox · pick from a list (input)
Combobox11 entriesWritten in a layer's descriptionHtml as {{combobox|parameter=value|...}}
Usage: '{{combobox}}' or examples.
data
Array.<Array.<String>>= undefined# Defines the data that will be displayed in the Combobox.
dataDefines the data that will be displayed in the Combobox.
|data = [["Val_1"], ["Val_2"],..]|editable
Boolean= false# Determines if the Combobox is editable.
editableDetermines if the Combobox is editable. That is, if it allows the user to type inside the input field. Set it true to allow it, false otherwise.
|editable=true|fieldLabel
String# Defines a label for the Combobox.
fieldLabelDefines a label for the Combobox. It will be shown at the left of the Combobox, by default.
|fieldLabel=This is the field label|getValue
function() : String# Returns the currently selected value (the text of the chosen data entry).
getValueReturns the currently selected value (the text of the chosen data entry). Call it on the component (Ext.getCmp(id) or a getid= reference); inputs.id[ID] already holds the same value.
Returns The selected value.
var region = Ext.getCmp('region_combo').getValue();hideLabel
Boolean= false# Defines if the label of the Combobox should be displayed.
hideLabelDefines if the label of the Combobox should be displayed. Set true to hide the label, false to show it.
|hideLabel=true|id
String# Defines the id to identify the object.
idDefines the id to identify the object.
|id=legend_combobox|labelStyle
String# Defines the style of the label.
labelStyleDefines the style of the label. You can use CSS to style the label element.
|labelStyle=font-weight: bold; color: red;|onSelect
function# Defines a callback run when the user picks an entry.
onSelectDefines a callback run when the user picks an entry. It receives the Ext select event arguments (combo, record, index) — read the chosen text with record.get('value') — and this is the layer. The value is resolved as a key of the layer functions object or, failing that, the text itself is evaluated as a function (a body or a full function(){...}); unlike the other callbacks it does NOT look for a global (setQueryGlobalProperties) function of that name. PS: the layer is recalculated on select anyway; use onSelect for side effects such as changing layers or updating a window.
|onSelect=onRegionSelected|functions: {
onRegionSelected: function(combo, record, index) {
this.changeLayers({name: 'CSR:' + record.get('value'), index: 0});
}
}setValue
function(value)# Selects an entry from code.
setValueSelects an entry from code. Pass one of the data values; it does not fire select, so call forceRecalc() on an InputManager (or fire the event) when the layer must be recalculated.
- value String
- One of the values listed in
data.
Ext.getCmp('region_combo').setValue('Protected Areas');value
String# Value stored in inputs.id[ID] (and inputs[i]): the selected entry of data as a string (the first entry is selected initially).
valueValue stored in inputs.id[ID] (and inputs[i]): the selected entry of data as a string (the first entry is selected initially). The layer recalculates on the combobox select event (user choice).
{{combobox|id=region_combo|fieldLabel=Region|data=[['Municipalities'],['Protected Areas']]}}beforeCalc: function(inputs) {
var region = inputs.id['region_combo']; // 'Municipalities' or 'Protected Areas'
}width
Number= 190# Defines the width of the combobox in pixels.
widthDefines the width of the combobox in pixels.
|width=250|legendhtml · legend of the calculated map
LegendHtml7 entriesWritten in a layer's descriptionHtml as {{legendhtml|parameter=value|...}}
Usage: '{{legendhtml}}'
autoWidth
Boolean= true# Set true (default) to let the legend panel take the width of its container; set false to give it a fixed width.
autoWidthSet true (default) to let the legend panel take the width of its container; set false to give it a fixed width.
|autoWidth=false|width=250|filterLayers
Array.<Number>= null# Defines an array of indexes of layers to be included in map legend (from 0 to quantity of layers).
filterLayersDefines an array of indexes of layers to be included in map legend (from 0 to quantity of layers). If not defined, all layer legends are shown by default. Otherwise, only the listed indexes are included.
Ex: A composed layer with three maps: name: "CSR:estados,CSR:roads,CSR:municipalities", If 'filterLayers=[0,1]' is defined in the layer object only the legends of 'CSR:estatdos' and 'CSR:roads' are shown.
|filterLayers = [1,2]|id
String# Defines the id of the legend panel component (Ext.getCmp(id)), e.g. to show()/hide() it or to find the legend entries inside it.
idDefines the id of the legend panel component (Ext.getCmp(id)), e.g. to show()/hide() it or to find the legend entries inside it. Generated when omitted. Other GeoExt.WMSLegend/Ext.Panel configs (cls, style, hidden, useScaleParameter, autoWidth...) are passed through.
|id=main_legend|legendId
String= null# Defines the legend container id.
legendIdDefines the legend container id. You can use this id to toggle each legend filter individually.
|legendId=WIDGET_OBJECT_ID|preventClick
Boolean= false# Defines if the user can filter the maps categories by clicking on the legend.
preventClickDefines if the user can filter the maps categories by clicking on the legend. Set it true to ignore the legend click, false otherwise.
|preventClick = true|reverseLegend
Boolean= false# Defines if it should sort the legend on the decreasing order.
reverseLegendDefines if it should sort the legend on the decreasing order. Set it true to use the decreasing order, false otherwise.
|reverseLegend = true|useScaleParameter
Boolean= false# Set true to request a new legend image from the server whenever the map scale changes (GeoServer SCALE parameter), for styles that depend on the scale.
useScaleParameterSet true to request a new legend image from the server whenever the map scale changes (GeoServer SCALE parameter), for styles that depend on the scale. Off by default: the legend is generated once and reused, which is faster and keeps the click-to-filter behaviour stable.
|useScaleParameter=true|Group properties
GroupProperties2 entriesdefaultProperties
Object= {}property# Specifies properties that apply universally to all layers within a group, including nested subgroups and their respective layers.
defaultPropertiesSpecifies properties that apply universally to all layers within a group, including nested subgroups and their respective layers. Priority is determined by specificity: a property defined at the layer level takes precedence, followed by properties defined in the nearest group, and so forth.
[
  {
     title: 'Example of defaultProperties',
     color: '#FFA500',
     defaultProperties: {
        source: 'local',
        visibility: true,
        opacity: 0.7,
     },
     elements: [
        {
           title: 'Layer 1',
           name: 'CSR:geologia',
        },
        {
           title: 'Layer 2',
           name: 'CSR:rios_principais',
        },
        {
           title: 'Layer 3',
           name: 'CSR:estados',
           // Any internal redefinition will override the defaultProperties
           visibility: false,
        },
     ],
  },
]
viewTitle
String= string.emptyproperty# Define the Title of the View that will gather together the elements inside it (Groups or other Views).
viewTitleDefine the Title of the View that will gather together the elements inside it (Groups or other Views). If an external View has in its elements another definition of a 'viewTitle', subviews will be created, like in the second example.
// Exemple 1: View with a Layers inside it
[
  {
     viewTitle: 'This View has a Group 3 Layers',
     title: 'This is a Group with 3 Layers',
     color: '#5BA300',
     elements: [
        {
           title: 'Layer 1',
           name: 'CSR:estados',
           source: 'local',
           opacity: 0.5,
           visibility: true,
        },
        {
           title: 'Layer 2',
           name: 'CSR:rios_principais',
           source: 'local',
           opacity: 0.5,
           visibility: true,
        },
        {
           title: 'Layer 3',
           name: 'CSR:geologia',
           source: 'local',
           opacity: 0.65,
           visibility: true,
        },
     ],
  },
]
// Exemple 2: View with others 'viewTitle' defined inside it
[
{
// This is the definition of the View
viewTitle: 'This External View has 2 others Inner Views inside it, each with 1 Group that has 1 Layer',
title: 'This View has 2 Groups, each with 1 Layer',
color: '#0073E6',
elements: [
{
title: 'Group 1',
// This 'viewTitle' will create a division in the menu that shows when the mouse hovers the navigation bar option 'This View has 2 Groups, each with 1 Layer'
viewTitle: 'Inner View with Group 1',
color: '#E6308A',
elements: [
{
title: 'Group 1 - Layer 1',
name: 'CSR:altimetria',
source: 'local',
visibility: true,
},
],
},
{
title: 'Group 2',
// This 'viewTitle' will create a division in the menu that shows when the mouse hovers the navigation bar option 'This View has 2 Groups, each with 1 Layer'
viewTitle: 'Inner View with Group 2',
color: '#B51963',
elements: [
{
title: 'Group 2 - Layer 1',
name: 'CSR:batimetria',
source: 'local',
visibility: true,
},
],
},
],
},
]Layer callbacks: functions you write
LayersFunctions4 entriesbeforeCalc
function= nullcallback# This function is executed before any calculation is made in the 'expression()' function.
beforeCalcThis function is executed before any calculation is made in the 'expression()' function. It runs on calculated layers (source: 'calculate'), even when there is no 'expression()', and on file layers (source: 'file'), where it runs again whenever an input changes or a resource finishes loading (see VectorLayer.generateNewLegend).
- inputs Array
- The value of each input defined in the descriptionHtml. The order of the values is the same as the inputs (i.e. the first input in the descriptionHtml is inputs[0], the second is inputs[1] and so on).
[
  {
     title: 'Example of beforeCalc function',
     color: '#FFA500',
     elements: [
        {
           title: 'This beforeCalc function will show a message at the bottom right of the screen',
           name: 'CSR:geologia',
           source: 'calculate',
           visibility: true,
           paramsButtonConfig: [
              {
                 type: 'query',
                 pressed: true
              },
           ],
           descriptionHtml:
              '{{label|text=The beforeCalc function will be called after every user interaction before any calculation}}'
              +
              '{{textfield|fieldLabel=Enter your name|id=textInput|labelStyle=text-align:center;}}',
           beforeCalc: function(inputs) {
              let inputValue = inputs[0];
              ExtjsUtils.ALERTIFY.log('Hello ' + inputValue + '!');
           },
        },
     ],
  },
]
functions
Object= null# Associate custom functions to handle events on layer callbacks such as button callbacks or any layer callbacks.
functionsAssociate custom functions to handle events on layer callbacks such as button callbacks or any layer callbacks. These functions are scoped to the Layer and can be referenced by name on layer widget callbacks. Functions can also be accessed using this.functions['<function_name>'].
[
  {
     title: 'Example of functions property',
     color: '#666699',
     elements: [
        {
           title: 'Click the button to see a message',
           name: 'CSR:geologia',
           group: 'Query',
           source: 'calculate',
           visibility: true,
           paramsButtonConfig: [
              {
                 type:'query',
                 pressed: true,
              },
           ],
           descriptionHtml:
              '{{button|id=test_button|text=Click me!|handler=handleTestButtonClick}}',
           functions: {
              handleTestButtonClick: function() {
                 ExtjsUtils.ALERTIFY.log('Button clicked!');
              },
           },
        },
     ],
  },
]
onInputsReady
function= nullcallback# This function is called when all inputs have been loaded and are ready.
onInputsReadyThis function is called when all inputs have been loaded and are ready. Even from Layers that aren’t visible.
- inputs Array
- The value of each input defined in the descriptionHtml. The order of the values is the same as the inputs (i.e. the first input in the descriptionHtml is inputs[0], the second is inputs[1] and so on).
[
  {
     title: 'Example of onInputsReady function',
     color: '#666699',
     elements: [
        {
           title: 'This Layer shows the starting value of the text input field',
           name: 'CSR:geologia',
           group: 'Query',
           source: 'calculate',
           visibility: true,
           paramsButtonConfig: [
              {
                 type:'query',
                 pressed: true,
              },
           ],
           descriptionHtml:
              '{{textfield|id=textInput|fieldLabel=Message|value=I love maps!|labelStyle=text-align:center;}}',
           onInputsReady: function(inputs) {
              let textInputValue = inputs[0];
              ExtjsUtils.ALERTIFY.log('The text input initial value is: ' + textInputValue);
           },
        },
     ],
  },
]
onVisibilityChange
function= nullcallback# This function is called whenever a Layer changes its visibility.
onVisibilityChangeThis function is called whenever a Layer changes its visibility. Like, when the user toggle the value in the visibility button at the top right in the Legend Window.
- visibility Boolean
- It’s true if the Layer is visible or false otherwise.
- inputs Object
- The value of each input defined in the descriptionHtml. The order of the values is the same as the inputs (i.e. the first input in the descriptionHtml is inputs[0], the second is inputs[1] and so on).
[
  {
     title: 'Example of callback when changing the visibility',
     color: '#FFA500',
     elements: [
        {
           title: 'The function onVisibilityChange will be called when the visibility of this layer changes.',
           name: 'CSR:geologia',
           source: 'calculate',
           visibility: true,
           paramsButtonConfig: [
              {
                 type:"query",
                 pressed: true
              },
           ],
           descriptionHtml:
              '{{label|text=You can change the map visibility by clicking at the eye icon on the top of this window}}',
           onVisibilityChange: function(state, inputs) {
              if(state) {
                 ExtjsUtils.ALERTIFY.log('The layer is now visible');
              }
              else {
                 ExtjsUtils.ALERTIFY.log('The layer is now hidden');
              }
           },
        },
     ],
  },
]