AMAZONES - Brazil nut

AMAZONES - Brazil nut

Part of the project Amazon Ecoservices (AMAZONES).

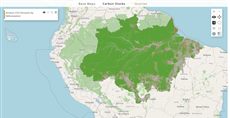
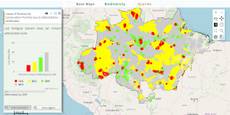
This map belongs to Amazon Ecoservices (AMAZONES) and is shown on its Brazil nut page. The “Brazil Nut” group maps the favourability, yield and rent of Brazil nut collection across the Amazon. The query layer “Brazil nut values per region” compares places: pick municipalities or protected areas, pick total potential production (kg), mean productivity (kg/ha) or mean rent (US$/ha/year), then click areas on the map. Each click adds or removes an area, and a column chart compares the selection. The code is query 4; it is built the same way as the rubber map, so the two are a good pair for seeing how one query is reused for another product by renaming its maps and widget ids.

How it is built

  • Two comboboxes choose the kind of region and the item. See Combobox.
  • A pickpoint collects the clicked areas. With markLayerInd=1 it stores each clicked polygon’s attributes; beforeCalc reads them with getAttributes(1) and clears them when a combobox changes. See PickPoint.
  • changeLayers swaps the map. A combobox change makes beforeCalc load the municipalities or the protected-areas map with the style of the chosen item. See the execution model.
  • A Highcharts column chart shows one column per picked area, in that area’s map colour. See charts.
  • Groups are arrays whose first item gives the title and color. See the layer and group model.

Try this

  • Keep Municipalities, choose “Total potential production (kg)” and click four municipalities in Acre and Pará.
  • Switch to Protected Areas: the selection is cleared and the map changes.
Reference: the parameters used here

Generated from the platform source. Every entry, searchable, is in the API reference; the raw data is api.json. Open an entry for its description, parameters and example; # links to it.

combobox · pick from a list (input)

Combobox2 entries

Written in a layer's descriptionHtml as {{combobox|parameter=value|...}}

It creates an input of ComboBox tool where the value is selectable from a list.
Usage: '{{combobox}}' or examples.
This button is created from Ext.form.ComboBox for customized properties click on API here.

data

Array.<Array.<String>>= undefined# Defines the data that will be displayed in the Combobox.

Defines the data that will be displayed in the Combobox.

|data = [["Val_1"], ["Val_2"],..]|

editable

Boolean= false# Determines if the Combobox is editable.

Determines if the Combobox is editable. That is, if it allows the user to type inside the input field. Set it true to allow it, false otherwise.

|editable=true|

pickpoint · pick a point on the map (input)

PickPoint3 entries

Written in a layer's descriptionHtml as {{pickpoint|parameter=value|...}}

Creates an input that allows users to interact with the real cell or feature value at any position.

The returned values are from the original mal to the selected point,
in case of RASTER is returned a cell value, in case of shapefile the geometry is returned too.
Usage: {{pickpoint}}
View the complete PickPoint API here

getAttributes

function(mapIndex) : Array.<Object># Returns the attributes of every selected point for one of the layers of the composed map: one object per selection (in click order) holding the feature data of that layer, or {} when the click …

Returns the attributes of every selected point for one of the layers of the composed map: one object per selection (in click order) holding the feature data of that layer, or {} when the click hit nothing on it (e.g. a raster). This is the usual way to read the selection in beforeCalc.

mapIndex Number
0-based index of the layer inside the composed layer (name order).

Returns Attribute objects of the selected features on that layer.

beforeCalc: function(inputs) {
    var picked = inputs.id['property_pick'].getAttributes(1);
    var names = picked.map(function(attrs) { return attrs.Name; });
}

markLayerInd

Number# Defines by layer index which one to draw its geometry when a click event happens.

Defines by layer index which one to draw its geometry when a click event happens. (0-indexed)

|markLayerInd = 0|

removeAttribute

function(index)# Removes one selection (by its position in the getAttributes list) from the map and from the selection list.

Removes one selection (by its position in the getAttributes list) from the map and from the selection list. An invalid index changes nothing.

index Number
0-based index of the selection to remove (same order as getAttributes).
var pick = inputs.id['property_pick'];
for (var i = pick.getAttributes(1).length - 1; i >= 0; i--) {
    if (!pick.getAttributes(1)[i].Name) pick.removeAttribute(i);
}

Highcharts · charts

Highcharts1 entry
Highcharts is a library used to easly create interactive charts.
Usage: (Highcharts.chart(DOM_ID, {});)
Highcharts JS has a complete set of examples and a nice documentation that can be accessed here.

chart

function(renderTo, options) : Object# Highcharts is loaded by the calculator and editor pages, so a query can call Highcharts.chart(...) without loading anything: put a container in the layer's descriptionHtml and create the chart …

Written as Highcharts.chart

Highcharts is loaded by the calculator and editor pages, so a query can call Highcharts.chart(...) without loading anything: put a container in the layer's descriptionHtml and create the chart once the panel exists - in onInputsReady, in beforeCalc or in a widget handler - then update it as results arrive instead of recreating it. ExtjsUtils.HIGHCHART.getById(id) gives the chart back from the container's id, which is what makes the update possible from another callback.

The bundled build covers the standard chart types plus highcharts-more. Extra modules are loaded on demand with AsyncLoader.loadScriptOnce (see the Sankey entry).

renderTo String
Id of the container element declared in descriptionHtml.
options Object
The Highcharts configuration object.

Returns The chart instance.

descriptionHtml: '<div id="emissions_chart" style="height:220px"></div>',
functions: {
    drawChart: function (values) {
        var chart = ExtjsUtils.HIGHCHART.getById('emissions_chart');
        if (chart) { chart.series[0].setData(values); return; }
        Highcharts.chart('emissions_chart', {
            chart: { type: 'column' },
            title: { text: 'Emissions by year' },
            xAxis: { categories: ['2020', '2021', '2022'] },
            series: [{ name: 'Mt', data: values }]
        });
    }
}

Calculated layers: methods (this.)

LayerInternal1 entry
Methods of a calculated layer that your functions call on this - this.setCalculateLegend in beforeCalc, this.changeLayers to switch its maps, this.getInputs... They are not keys you write in the layer.
View all layer internal helper functions API here.

changeLayers

function(newConfigs, force)method# Replaces an internal layer at a given index.

Written as this.changeLayers

Replaces an internal layer at a given index. PS: It's highly recommended to pass multiple configurations in an array, instead of calling this function multiple times in the same callback.

newConfigs Array|Object
One or more layers configurations with a property 'index' indicating the replacing layer. Each config object must contain at least the following properties: [{name: 'MAP_FULL_NAME', styles: 'MAP_STYLE', index: 'MAP_INDEX_TO_CHANGE'}, ... ]
force Boolean
Force redraw even if no change is done when the layer is the same.
{
     name: "CSR:rodovias,CSR:municipios",
     otherNames: "CSR:roads",
     beforeCalc: function(layerVals, inputVals) {
         this.changeLayers([{name: 'CSR:roads', styles: fMapName + "_1", index: 0}]);
     }
  }

Layer callbacks: functions you write

LayersFunctions1 entry
Functions you write in a layer and the platform calls: expression, afterCalc and legendColor on calculated layers; beforeCalc, onInputsReady, onVisibilityChange and the functions map on calculated and file layers. Inside them this is the layer - except in expression, see Kinds of layer.

beforeCalc

function= nullcallback# This function is executed before any calculation is made in the 'expression()' function.

This function is executed before any calculation is made in the 'expression()' function. It runs on calculated layers (source: 'calculate'), even when there is no 'expression()', and on file layers (source: 'file'), where it runs again whenever an input changes or a resource finishes loading (see VectorLayer.generateNewLegend).

inputs Array
The value of each input defined in the descriptionHtml. The order of the values is the same as the inputs (i.e. the first input in the descriptionHtml is inputs[0], the second is inputs[1] and so on).
[
  {
     title: 'Example of beforeCalc function',
     color: '#FFA500',
     elements: [
        {
           title: 'This beforeCalc function will show a message at the bottom right of the screen',
           name: 'CSR:geologia',
           source: 'calculate',
           visibility: true,
           paramsButtonConfig: [
              {
                 type: 'query',
                 pressed: true
              },
           ],
           descriptionHtml:
              '{{label|text=The beforeCalc function will be called after every user interaction before any calculation}}'
              +
              '{{textfield|fieldLabel=Enter your name|id=textInput|labelStyle=text-align:center;}}',
           beforeCalc: function(inputs) {
              let inputValue = inputs[0];
              ExtjsUtils.ALERTIFY.log('Hello ' + inputValue + '!');
           },
        },
     ],
  },
]

Layer properties

LayersProperties2 entries
Keys of a layer object: which map it shows (name, source, styles), how it looks (title, opacity, visibility) and how its row and panel behave.

opacity

Numeric= 1property# Define the opacity of the Layer.

Define the opacity of the Layer. The opacity is a value between 0 and 1 that is a scale for its transparency. 0 is completely transparent. 1 is completely visible.

[
 {
   title: 'Example of opacity in a Layer',
   color: '#666699',
   elements: [
     {
       title: 'This Layer has its opacity set to 50% of the original visibility',
       name: 'CSR:geologia',
       source: 'local',
       visibility: true,
       opacity: 0.5,
     },
   ],
 },
]

updateAutomatically

Boolean= falseproperty# Decides what happens when the reader changes an input of the layer's panel (a widget in descriptionHtml).

Decides what happens when the reader changes an input of the layer's panel (a widget in descriptionHtml). true: the layer is calculated again at once. false (the default): a short countdown starts, with a button to refresh now, so several changes make one calculation. The layer is drawn either way. Applies to calculated and file layers.

[
 {
   title: 'The map will be automatically calculated',
   color: '#666699',
   elements: [
     {
       title: 'This layer is showing just one type of relief',
       name: 'CSR:geologia',
       source: 'calculate',
       visibility: true,
       updateAutomatically: true,
       expression: function(layersVals, inputs) {
         // layerVals have the value of the legend applied in every pixel of the map
         let mapValue = layersVals[0];

         // Remove every type of relief that is not 'Mantiqueira'
         if(mapValue != 'Mantiqueira') { // If the pixel is not 'Mantiqueira'
             return undefined; // Don't show the pixel
         }

         // If the pixel is 'Mantiqueira', return the value of the pixel
         return mapValue;
       },
     },
   ],
 },
]