Quick start
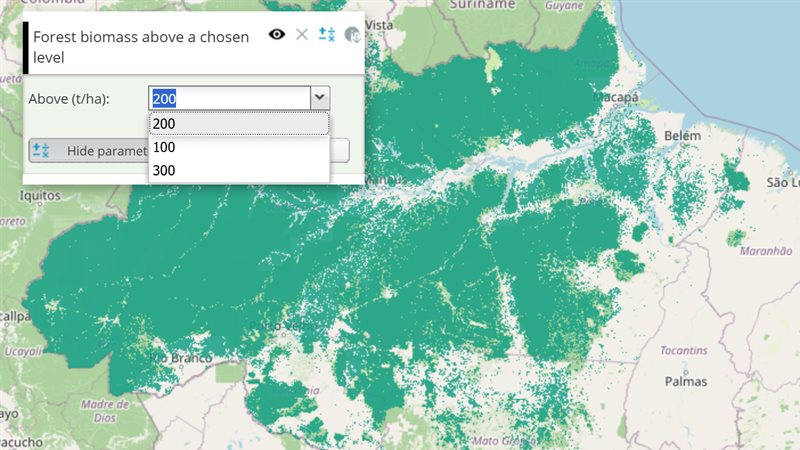
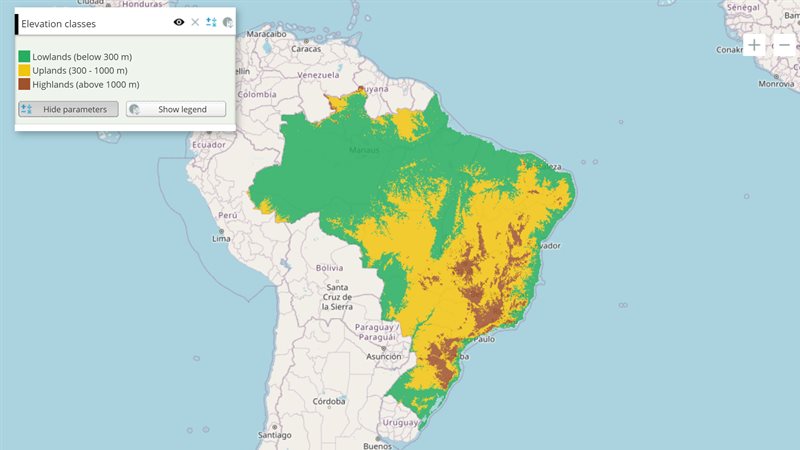
The example below, running in the Mappia calculator - click it to run it live. Full-size picture
- Run it
Click the picture: the map opens right here and runs the example. Nothing is saved, and nothing to install.
- Try it
- Click the pencil on the “Areas of interest” layer row, then click the map to place corners.
- Double-click, or press Enter, to close the polygon. Click it later to drag its vertices.
- Use the trash can on the same row to remove every shape.
- Make it yours
Copy the query, change it - the key parameters are below - and run it again in the playground, or paste it into the Mappia editor to save it as your map.
Key parameters
| Parameter | Example | What it does |
|---|---|---|
drawable | { drawModes: ["polygon", "line"], drawingHints: "bar" } | Makes the layer editable and adds pencil, trash-can, undo and upload buttons to its row. true uses the defaults. |
onFeatureChangeCallback | function (type, features, detail) { } | Runs after every change; type is "editend" when a shape is committed, and detail.drawMode says polygon or line. |
onBeforeFeatureChangeCallback | function (type) { return type !== "add" || this.features.length < 5; } | Runs before shapes are added or removed; return false to cancel the change. |
activateDrawMode | layer.drawableController.activateDrawMode("polygon") | Enters draw mode with that tool from your own code, as the toolbar pencil does. |
Every parameter, with its type and default, is in the reference at the end of this page.
Complete example
The query 19 lines · runs as is
// Drawing shapes: `drawable` makes a vector layer editable - sketch polygons with the
// toolbar pencil (or the layer's drawableController.activateDrawMode("polygon")) and drag
// their vertices. The platform does not cut or merge shapes on its own: a "line" sketch adds
// a line feature, and overlap rules apply only when your code calls layer.resolveOverlap.
[
  {
    title: "Areas of interest",
    name: "areas_of_interest",
    source: "file",
    type: "empty",
    visibility: true,
    drawable: {
      drawModes: ["polygon", "line"], // the tools offered by the toolbar pencil
      onDrawingStatusChange: function (detail) {
        console.log(detail.status); // off | ready | drawing | drawing_line | feature_selected | vertex_drag
      },
    },
  },
];
Customize it
The drawable options
drawModes:["polygon"](the default) or["polygon", "line"]. With both, the pencil gets a small menu to choose the tool.onDrawingStatusChange(detail):detail.statusisoff,ready,drawing,drawing_line,feature_selectedorvertex_drag;detail.canFinishDrawinganddetail.canApplyFeatureChangestell whether your own Finish and Apply buttons should be enabled.onEditToggle(active, detail): draw mode was switched on or off.drawingHints: "bar"shows a one-line hint at the bottom of the map;trueadds hint buttons next to the pencil. The hint texts are in Portuguese.buttons: { loadFile: false, clear: false }hides buttons of the layer row. Ahandlergiven there runs after the built-in action.maxGeomCountandonGeomLimitReachedlimit how many shapes an uploaded file may add. Shapes drawn by hand are not counted; to cap them, returnfalsefromonBeforeFeatureChangeCallback, as in the table above.
Drive it from your own buttons
The draw-mode methods live on the layer’s drawableController:
var layer = ExtjsUtils.LAYER.getLayerByName("areas_of_interest");
layer.drawableController.activateDrawMode("polygon"); // same as the pencil
layer.drawableController.finishDrawing();             // same as a double-click
layer.drawableController.cancelDrawing();             // drop the sketch in progress
layer.drawableController.applyFeatureChanges();       // finish the sketch or the vertex edit
layer.features lists the shapes, and layer.getEditingFeatureId() tells which one is being edited.
Lines and overlaps are yours to handle
The platform does not cut polygons or resolve overlaps by itself. A line is added to the layer as a line feature, and a polygon drawn over another is simply added. Both end in onFeatureChangeCallback with type "editend", which is where you act. layer.resolveOverlap(edited, overlapping) applies the onOverlap rule: one key ("merge", "cut" or "keep") applies directly, a list asks the user (the prompt is in Portuguese).
onFeatureChangeCallback: function (type, features, detail) {
  if (type !== "editend" || (detail && detail.drawMode === "line")) return;
  var layer = this;
  var edited = features.map(function (f) { return f.geometry; });
  ExtjsUtils.GEOMETRY.loadGeometryLibrary(function () {
    var others = layer.features.filter(function (f) { return features.indexOf(f) < 0; })
      .map(function (f) { return f.geometry; });
    layer.resolveOverlap(edited, ExtjsUtils.GEOMETRY.findIntersecting(edited, others));
  });
},
To reshape shapes yourself, for example to clip them to a boundary or split them along a line with your own function, layer.applyGeomOp(geometries, options) replaces them with a difference, an intersection or the pieces your function returns, keeping their ids and attributes.
Pitfalls
- Only
source: "file"layers can be drawable;type: "empty"starts with no shapes. - Hiding the layer leaves draw mode; showing it again resumes it.
- Many existing maps use the older
setDrawing(enabled, callbackOnAdd): draw only, without the toolbar, vertex editing or status. It still works; preferdrawablefor new maps.