Quick start
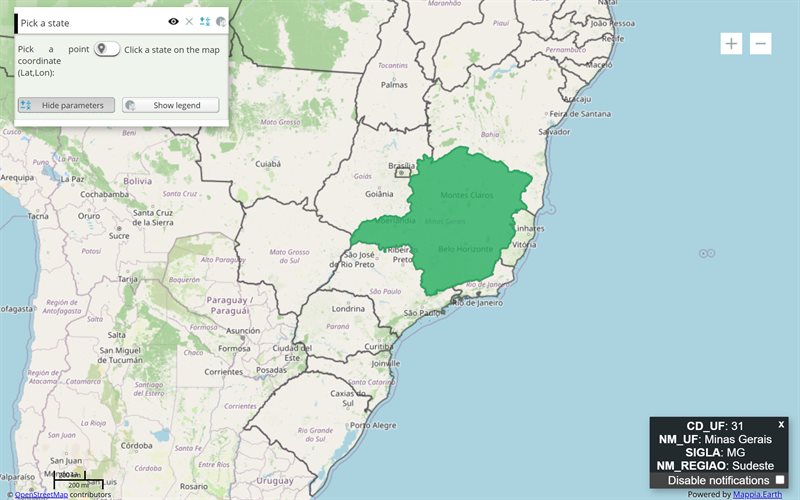
The example below, running in the Mappia calculator - click it to run it live. Full-size picture
- Run it
Click the picture: the map opens right here and runs the example. Nothing is saved, and nothing to install.
- Try it
- Find the red dot over Belo Horizonte: the overlay draws it once the map has loaded.
- Look at the layer panel: only States is listed - the dot has no row and no switch.
- Change the coordinates in
createPointand run it again: the dot moves to the new place.
- Make it yours
Copy the query, change it - the key parameters are below - and run it again in the playground, or paste it into the Mappia editor to save it as your map.
Key parameters
| Parameter | Example | What it does |
|---|---|---|
LayerAdditional | new Ext.LayerAdditional({}, ExtjsUtils.JS.getMap()) | Creates the overlay on the map. Create it once and reuse it for every marker. |
createPoint | overlay.createPoint(-43.94, -19.92, "EPSG:4326") | A point from coordinates in the projection you name, converted to the map’s. Longitude comes first. |
createFeature | overlay.createFeature(point) | Wraps a geometry, or an array of them, into a feature you can style and draw. |
drawFeature | overlay.drawFeature(city, { fillColor: "#e74c3c", fillOpacity: 1, pointRadius: 11 }) | Styles and draws a feature in one call. Without fillOpacity: 1 the fill stays translucent. |
removeFeatures | overlay.removeFeatures() | Clears the overlay. With no argument every feature is removed; pass features to remove only those. |
Every parameter, with its type and default, is in the reference at the end of this page.
Complete example
The query 11 lines · runs as is
// Overlay layer: Ext.LayerAdditional draws markers and highlights without adding a row to the
// layer panel. runNow is the one global the platform calls itself, once, after loading.
ExtjsUtils.QUERY.setQueryGlobalProperties({
  runNow: function () {
    var overlay = new Ext.LayerAdditional({}, ExtjsUtils.JS.getMap());
    var city = overlay.createFeature(overlay.createPoint(-43.94, -19.92, "EPSG:4326")); // Belo Horizonte
    overlay.drawFeature(city, { graphicName: "circle", pointRadius: 11, fillColor: "#e74c3c", fillOpacity: 1, strokeColor: "#ffffff", strokeWidth: 3 });
  },
}) && [
  { name: "CSR:estados", title: "States", visibility: true, opacity: 0.4 },
];
Customize it
Run it once the map is ready
The overlay needs the map, so create it in code that runs after loading. runNow is the one global the platform calls by itself, once, after the query loads; declare it with ExtjsUtils.QUERY.setQueryGlobalProperties, as the example does. A button handler, a click callback or a message from the page that embeds the map (MappiaIO) work too.
Keep one overlay and redraw it
To move a marker, clear the overlay and draw again. Keep the overlay in a query global so every call reuses it:
ExtjsUtils.QUERY.setQueryGlobalProperties({
  spotOverlay: null,
  markSpot: function (lon, lat) {
    if (!window.spotOverlay) window.spotOverlay = new Ext.LayerAdditional({}, ExtjsUtils.JS.getMap());
    var overlay = window.spotOverlay;
    overlay.removeFeatures();                                  // clear the previous marker
    var spot = overlay.createFeature(overlay.createPoint(lon, lat, "EPSG:4326"));
    overlay.drawFeature(spot, { graphicName: "circle", pointRadius: 9, fillColor: "#e74c3c",
      fillOpacity: 1, strokeColor: "#ffffff", strokeWidth: 2 });
  },
}) && [{ name: "CSR:estados", title: "States", visibility: true }];
Then any callback can call window.markSpot(-43.94, -19.92).
More than points
createPolygon([p1, p2, p3])makes a polygon from points made withcreatePoint; the ring closes by itself.drawLatLongExtents([west, south, east, north], color)outlines a longitude/latitude box, the way the interface highlights a layer’s extent.- GeoJSON goes in with
overlay.addFeatures(ExtjsUtils.GEOJSON.geojson2Features(geojson, "EPSG:4326")). Name the projection: without it the data is read as Web Mercator metres and lands in the wrong place.
Style
drawFeature takes OpenLayers style properties: fillColor, fillOpacity, strokeColor, strokeWidth, pointRadius, graphicName ("circle", "square", "star"…), externalGraphic (an image URL) and label. Features added with addFeatures use the overlay’s own style instead: a plain grey and white one, unless you create the overlay first with overlay.createLayer({ styleMap: new OpenLayers.StyleMap({...}) }).
Show, hide and remove
The overlay does not follow any other layer: overlay.setVisibility(false) hides it and setVisibility(true) shows it again. removeLayer() takes it off the map entirely.
When to use a file layer instead
The overlay is deliberately invisible to the layer panel: the user cannot turn it off, and it has no click callbacks of its own. For data the user should see listed, switch on and off and click, use a file layer.