Quick start
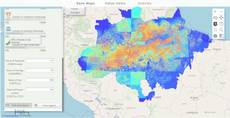
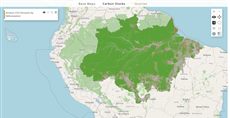
The example below, running in the Mappia calculator - click it to run it live. Full-size picture
- Run it
Click the picture: the map opens right here and runs the example. Nothing is saved, and nothing to install.
- Try it
- Drag the slider to 250 and let go: after a short countdown, only the forest storing more than 250 tC/ha stays green.
- Drag it down to 50: much more forest turns green, and the legend changes to Above 50 tC/ha.
- Make it yours
Copy the query, change it - the key parameters are below - and run it again in the playground, or paste it into the Mappia editor to save it as your map.
- More ways to use it
Key parameters
| Parameter | Example | What it does |
|---|---|---|
id | threshold | Names the value: read it as inputs.id['threshold'] in beforeCalc, and by position (inputs[0] here) inside expression. |
value | 150 | Where the thumb starts. Without it the slider starts at 100. |
minValue | 0 | Lowest value the slider can reach (default 0). |
maxValue | 300 | Highest value the slider can reach (default 100). |
increment | 25 | Step the thumb snaps to while the user drags it. |
text | Minimum carbon stock (tC/ha) | Text of the label placed before the slider. It is shown as plain text; use html for bold or links. |
Every parameter, with its type and default, is in the reference at the end of this page.
Complete example
The query 24 lines · runs as is
// Slider and Label: show only the forest carbon stock above the value chosen on the slider.
// beforeCalc runs on the page (inputs.id works there); expression runs in a worker
// (inputs is a plain array there: inputs[0] is the first input widget, the slider).
[
  {
    title: "Carbon stock above a threshold",
    name: "CSR:biomassa_inv_br_redd",
    source: "calculate",
    opacity: 0.85,
    visibility: true,
    paramsButtonConfig: [{ type: "query", pressed: true }],
    descriptionHtml:
      "{{label|text=Minimum carbon stock (tC/ha)}}" +
      "{{slider|id=threshold|minValue=0|maxValue=300|increment=25|value=150|width=250}}",
    beforeCalc: function (inputs) {
      this.setCalculateLegend([
        { color: [30, 132, 73], value: 1, title: "Above " + inputs.id["threshold"] + " tC/ha" },
      ]);
    },
    expression: function (layersVals, inputs) {
      return layersVals[0] >= inputs[0] ? 1 : this.nullValue;
    },
  },
];
More examples
Other ways to use Slider and Label, each a complete query that runs as is - like the one above.
Coloured track
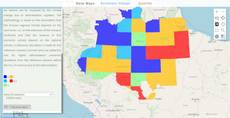
The slider’s track is painted with colours by value, so the reader sees what each position means before moving it.
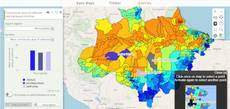
Click the picture to run it live. Full-size picture
The query 25 lines · runs as is
// Coloured track: the slider's track is painted with colours by value, so the reader sees what each position means before moving it.
// backgroundColors paints the track from each startValue on, and gradient=true blends one colour
// into the next. The layer keeps the land higher than the chosen elevation.
[
  {
    title: "Land above an elevation",
    name: "CSR:altimetria",
    source: "calculate",
    opacity: 0.85,
    visibility: true,
    paramsButtonConfig: [{ type: "query", pressed: true }],
    descriptionHtml:
      "{{label|text=Minimum elevation (m)}}" +
      "{{slider|id=minimum|minValue=0|maxValue=2000|increment=100|value=800|width=250|gradient=true" +
      '|backgroundColors=[{color: "#2e7d32", startValue: 0}, {color: "#f9a825", startValue: 700}, {color: "#8d4925", startValue: 1400}]}}',
    beforeCalc: function (inputs) {
      this.setCalculateLegend([
        { color: [141, 73, 37], value: 1, title: "Above " + inputs.id["minimum"] + " m" },
      ]);
    },
    expression: function (layersVals, inputs) {
      return layersVals[0] >= inputs[0] ? 1 : this.nullValue;
    },
  },
];
Two sliders, two maps
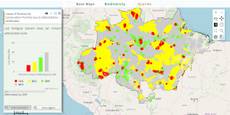
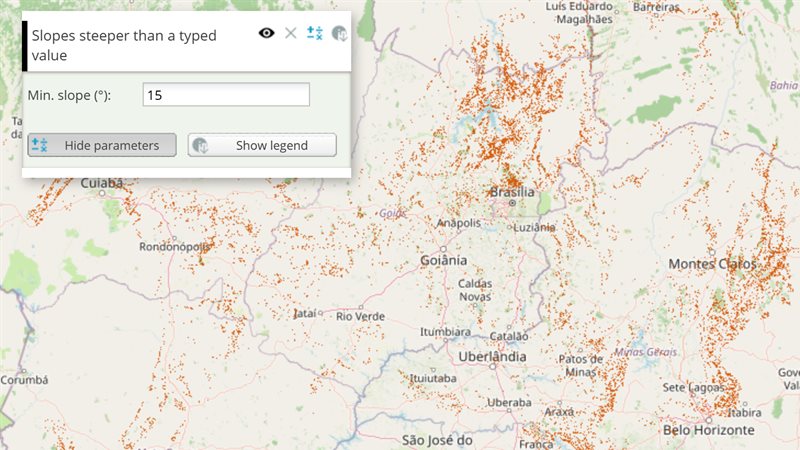
One slider per map, and the layer keeps the places that pass both - here land that is both high and steep, in the Cerrado.
Click the picture to run it live. Full-size picture
The query 30 lines · runs as is
// Two sliders, two maps: one slider per map, and the layer keeps the places that pass both - here land that is both high and steep, in the Cerrado.
// name lists both maps, so each pixel brings two values: layersVals[0] is the elevation and
// layersVals[1] the slope. The sliders are inputs[0] and inputs[1], in the order they appear.
[
  {
    title: "High and steep land",
    name: "CSR:altimetria,CSR:bioma_cerrado_declividade",
    source: "calculate",
    opacity: 0.9,
    visibility: true,
    paramsButtonConfig: [{ type: "query", pressed: true }],
    descriptionHtml:
      "{{label|text=Elevation above (m)}}" +
      "{{slider|id=min_elevation|minValue=0|maxValue=1600|increment=100|value=800|width=250}}" +
      "{{label|text=Slope above (degrees)}}" +
      "{{slider|id=min_slope|minValue=0|maxValue=40|increment=5|value=10|width=250}}",
    beforeCalc: function (inputs) {
      this.setCalculateLegend([
        {
          color: [192, 57, 43],
          value: 1,
          title: "Above " + inputs.id["min_elevation"] + " m, steeper than " + inputs.id["min_slope"] + " degrees",
        },
      ]);
    },
    expression: function (layersVals, inputs) {
      return layersVals[0] >= inputs[0] && layersVals[1] >= inputs[1] ? 1 : this.nullValue;
    },
  },
];
Customize it
Show the value while dragging
Add plugins=tip=<text> to show a tooltip above the thumb while the user drags it. {0} is replaced by the thumb’s value:
descriptionHtml:
  "{{label|text=Minimum carbon stock (tC/ha)}}" +
  "{{slider|id=threshold|minValue=0|maxValue=300|increment=25|value=150|plugins=tip={0} tC/ha|width=250}}",
To keep a label in step after each recalculation, give the label an id and set its text in beforeCalc: Ext.getCmp("threshold_label").setText("Above " + inputs.id["threshold"] + " tC/ha").
Colour the track
backgroundColors paints the filled part of the track by value, and gradient=true blends the colours into each other. Each colour starts at its startValue; the order of the entries does not matter. Here CSS colours are fine:
'{{slider|id=threshold|minValue=0|maxValue=300|value=150|backgroundColors=[{color: "khaki", startValue: 0}, {color: "darkgreen", startValue: 150}]|gradient=true|width=250}}'
More options
fieldLabelputs a label at the left of the slider;hideLabel=trueremoves it and the space kept for it.disabled=trueshows the slider greyed out. Enable it later withExt.getCmp(id).enable().clsandthumbStyleadd CSS classes to the slider and to its thumb.- Any other Ext JS slider option, such as
keyIncrement, is passed through unchanged.
Move it from code
Ext.getCmp(id).setValue(thumbIndex, value, false, true) moves the thumb and fires the same change as a drag, so the layer recalculates. A plain slider has one thumb, index 0. Ext.getCmp(id).getValue() reads the current value.
descriptionHtml:
  "{{slider|id=threshold|minValue=0|maxValue=300|increment=25|value=150}}" +
  "{{button|id=reset|text=Back to 150 tC/ha|handler=resetThreshold}}",
functions: {
  resetThreshold: function () {
    Ext.getCmp("threshold").setValue(0, 150, false, true);
  },
},
Recalculate without the countdown
After the user releases the thumb, the layer waits about 2.5 seconds, showing a countdown button, so several changes end in one recalculation. Set updateAutomatically: true on the layer to recalculate right away.
Pitfalls
- Inside
expressionthere is noinputs.id. Readinputs[0],inputs[1]… in the order the input widgets appear indescriptionHtml; labels and buttons take no position. The execution model explains why. setCalculateLegendtakes colours as[R, G, B]arrays. A CSS string such as"#c0392b"throwscolor.join is not a function. Only the slider’s ownbackgroundColorstake CSS colours.- A variable defined outside
expressionisundefinedinside it. Pass the value through an input instead.